はじめに
subplotを用いることで、複数の画像を1つのFigure内で表示する方法を紹介します。
プログラム例
作成したいプログラム
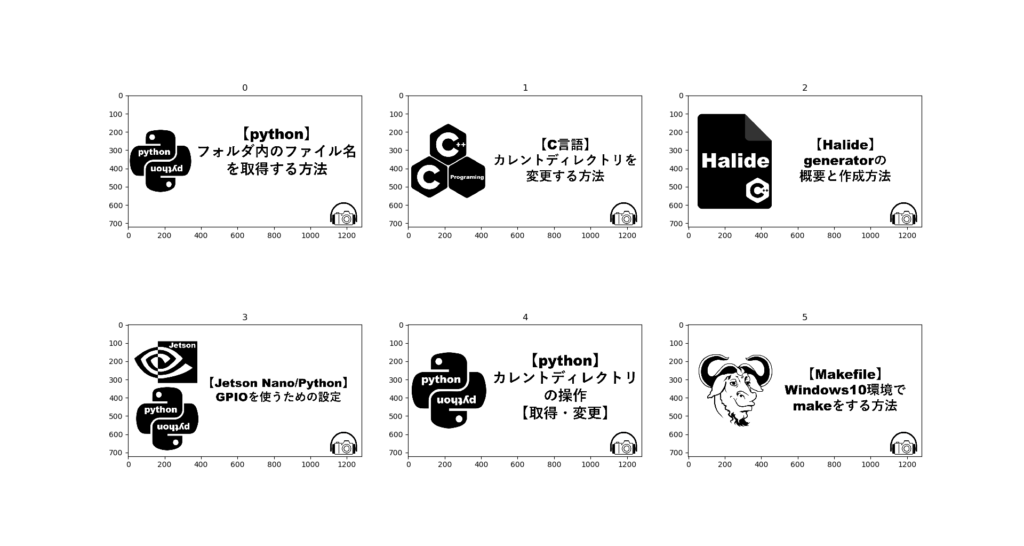
下図のように6枚の画像を読み込んで1つのfigureに表示するプログラムを作成します。
また、それぞれに対してtileを付けます。

プログラム例
|
1 2 3 4 5 6 7 8 9 10 11 12 13 14 15 16 17 18 19 20 |
import numpy as np from PIL import Image import matplotlib.pyplot as plt if __name__ == "__main__": image00 = Image.open('../../test_data/picture/sample00.png') image01 = Image.open('../../test_data/picture/sample01.png') image02 = Image.open('../../test_data/picture/sample02.png') image03 = Image.open('../../test_data/picture/sample03.png') image04 = Image.open('../../test_data/picture/sample04.png') image05 = Image.open('../../test_data/picture/sample05.png') images = [image00, image01, image02, image03, image04, image05] fig = plt.figure() for i, im in enumerate(images): fig.add_subplot(2,3,i+1).set_title(str(i)) plt.imshow(im) plt.show() |
fig.add_subplot()
plt.figure()に対してsubplotを追加します。
今回は下記の様に記述していますが、これは2行3列の枠のi+1番目に配置することを表しています。
|
1 |
fig.add_subplot(2,3,i+1) |
ここでi+1としているのは for文でi=0の時、0番目に配置できないとエラーが出てしまうためです。
|
1 |
ValueError: num must be 1 <= num <= 6, not 0 |


コメント